
Fri, Jul 31, 2026
[Archive]
Volume 1, Issue 2 (IJHMD 2024)
IJHMD 2024, 1(2): 14-17 |
Back to browse issues page


Ethics code: IR.GOUMS.REC.1398.329
Download citation:
BibTeX | RIS | EndNote | Medlars | ProCite | Reference Manager | RefWorks
Send citation to:


BibTeX | RIS | EndNote | Medlars | ProCite | Reference Manager | RefWorks
Send citation to:
Heidari A, Kabir M J, Khatirnamani Z, Rafiei N, Gholami M. Evaluation mortality trends and years of life lost due to causes of death in Northern Iran, 2011-2018. IJHMD 2024; 1 (2) :14-17
URL: http://jhd.goums.ac.ir/article-1-35-en.html
URL: http://jhd.goums.ac.ir/article-1-35-en.html
Alireza Heidari1 

 , Mohammad Javad Kabir1 , Zahra Khatirnamani *2 , Narges Rafiei1 , Masoumeh Gholami1
, Mohammad Javad Kabir1 , Zahra Khatirnamani *2 , Narges Rafiei1 , Masoumeh Gholami1
1- Health Management and Social Development Research Center, Golestan University of Medical Sciences, Gorgan, Iran
2- Health Management and Social Development Research Center, Golestan University of Medical Sciences, Gorgan, Iran ,khatirzahra@gmail.com
2- Health Management and Social Development Research Center, Golestan University of Medical Sciences, Gorgan, Iran ,
Full-Text [PDF 592 kb]
(940 Downloads)
| Abstract (HTML) (3137 Views)
For standardized measures, the direct standardization method, i.e. direct age matching, was used. Standard populations were also used to compare census results for the period under comparison. Also, to compare the death rate by year and the cause of the disease, the total population during the study years was used as the standard population.
In this study, the methodology from the 2003 Global Burden of Disease study was utilized to ensure comparability. Moreover, to calculate the years of life lost (YLL), the standard expected years of life lost (SEYLL) was used. This method uses the standard life expectancy at any age to estimate the years lost due to death at that age. This life expectancy is called standard because it is calculated based on a specific life table that gives the ideal life expectancy. The biological differences between males and females in terms of survival were 2.5 years, and the Coale and Demeny model life tables (Model West, level 26) for females and males were used to determine life expectancy in different age groups (17). The following calculations were performed using Excel templates provided by the primary designers of the disease burden project, along with the 2000 burden of disease project weights, which have been validated for compatibility with the perspectives of Iranian experts in the referenced articles (17,18).

Where:
N
L
r
β
C = Age-weighting correction constant (Global Burden of Disease standard value is 0.1658).
The demographic information of the deceased, which led to their identification, was initially deleted and then provided to the research team. The authors pledged that their personal and confidential information (Individually) would not be used. After modifying and cleaning the data, WinPepi 11.65 was used to calculate the rates, and Microsoft Excel 2016 was used for frequency distributions and line graphs.
Results
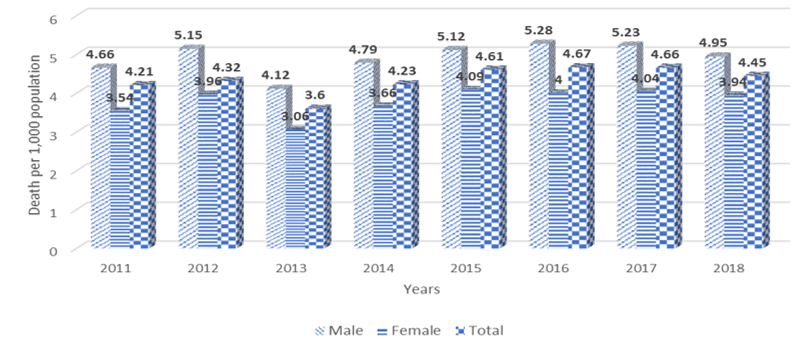
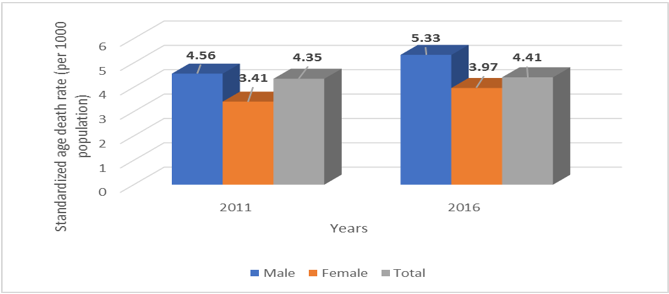
During 2011-2018, 60,082 deaths were reported, of which 56.8% were males and 43.2% were females. The mean age of the deceased was 58.92 ± 26.64 which was 57.25 ± 26.62 for males and 61.30 ± 26.32 for females. In all years related to this study, deaths were higher in males than females. The death rate was 4.9 per 1,000 population in males and 3.8 per 1,000 population in females. The average crude death rate was 4.34 per 1,000 population. The death rate was relatively constant from years 2011 to 2012 and after a slight decrease in 2013 (3.6 per 1,000 population) then had an upward trend and in 2017 reached 4.66 per 1,000 population (Figure 1). Age-specific death rate for 2011 and 2016 remained relatively constant, increasing from 4.35 per 1,000 population in 2011 to 4.41 in 2016 (Figure 2). In all study years, the highest death rate was in the age group of 65 years and older, followed by 55-64 years and in the age group of under five years. In general, after the initial five years of life, there is a consistent rise in mortality with increasing age, indicating a relatively high mortality rate.
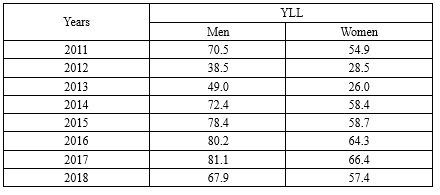
Causal-specific death rate trends show that cardiovascular diseases, accidents, cancers, and endocrine, nutritional, and metabolic diseases were the most important causes of death in 2011, respectively. In 2016, cardiovascular diseases, cancers, accidents, and congenital and chromosomal abnormalities were the most important causes of death, respectively. As shown in Figure 4, the trend of respiratory diseases increases slightly from 2011 to 2018. To compare the causal death rates for 2011 and 2016, the direct standardization method was employed, using the total provincial population of 3,633,794 for both years as the reference population. The death rate due to cardiovascular diseases and cancers in 2016 (2.19 and 0.59, respectively) was higher than in 2011 (1.65 and 0.43, respectively), while death rate due to external causes was lower in 2016 (0.44) than in 2011 (0.51) (Table 1). In Golestan Province from 2011 to 2018, there were a total of 862,542 years of life lost due to premature death, which was 499,300 years for males and 363,242 years for females. The total number of years of life lost in all years of 2011-2018 was more in males than females. The highest rate was 81.1 per 1,000 population in males and 66.4 per 1,000 population in 2017 (Table 2).
Discussion
In this study, the mortality trend in Golestan Province has been studied from 2011 to 2018. According to the findings, the average crude death rate during the study years was 4.34 per 1,000, with 4.91 and 3.79 per 1,000 population for males and females, respectively. In the study by Zangana et al. (2019) in Erbil, Iraq, between 2007 and 2011, the crude mortality rate was 3.1 per 1,000 population, indicating that the mortality rate was higher in females than in males (3.5 and 2.7, respectively) (2). In the study conducted by Torkashvand et al. (2019) in Ilam Province from 2011 to 2017, the death rate of males was higher than females (11). Sadek et al. (2012) assessed the mortality pattern in Basra, Iraq, using the registry system mortality data over two years (1978 and 2007). They showed the standardized age mortality rate in 2007 was 8.6% lower than in 1978. In both years, the standardized age mortality rate increased with age, so the highest rate was seen among the elderly 65 years and older (19).
The results showed that in 2011 and 2016, Age-specific death rate was relatively stable and increased from 4.35 per 1,000 population in 2011 to 4.41 in 2016. In another study, the mean Age-specific death rate for the years 2009 to 2011 was 4.6 per 1,000, which was similar to our study (2). The data showed that annually, the highest mortality rate was found among individuals aged 65 and older, followed by those between 55 and 64 years old, and then children under five. In the study of Abdollahzadeh et al. (2016) in the population covered by Birjand University of Medical Sciences, the highest number of deaths in 2018 was related to the age group of 70-90 years (20). In another study, the highest mortality rate was observed among individuals aged 75 years and older (2).
According to the findings, cardiovascular diseases, accidents, cancers, and endocrine, nutritional, and metabolic diseases were the most important causes of death in 2011, respectively. In 2016, cardiovascular diseases, cancers, accidents, and congenital and chromosomal abnormalities were the most important causes of death, respectively. In the study of Zangana et al. (2019), mortality due to accidents and cardiovascular diseases was the main cause of death with 65.2 and 58.3 per 100,000 population, respectively. The most common causes of death were accidents and injuries, which accounted for 29.1% of all deaths (65.24 per 100,000 people), followed by cardiovascular diseases with 25.5% (57.27 per 100,000 population), respiratory disorders with 18.9% (42.43 per 100,000 people) and cancers with 7.9% (15.60 per 100,000 people) (2).
In a study by Di Cecco et al. (2016) in Argentina, time series of deaths for individuals aged 1 to 24, categorized by sex and cause of death, were compiled for the period from 1947 to 2012. The highest reduction in mortality was observed in the age group of 1-4 years. Women and girls of all ages had a significant reduction in mortality. Mortality rates decreased in boys and men aged 15 to 24, but were much lower than in other groups. The mortality rate in this group was twice as high as women and girls by 2012. Mortality due to transmissible causes, nutrition, and childbirth decreased in all groups, while mortality due to sedation increased in young men (21).
In another study, the main causes of death were non-communicable diseases, cardiovascular diseases, cancers, and unintentional accidents, respectively (11). In the study by Sadek et al. (2012), among the nine causes of death, cardiovascular disease was the leading cause of death in both years. Cancer was the third leading cause of death in 1978 and the second leading cause of death in 2007. The standardized age mortality rate in 2007 was 6% higher than in 1978. In 2007, deaths from circulatory diseases in the elderly age group were 25.5% higher than the death rate for the same age group in 1978. External causes were the second leading cause of death in 1978 and the third leading cause of death in 2007. External causes were the main cause of death for the age group of 15-44 years each year (19).
Mortality due to accidents had a decreasing trend during the study years. The study of Askari Shahi et al. Also showed that the mortality rate due to road accidents during the study period had a decreasing trend (22). Deaths due to certain conditions originating around birth were also among the main causes of death, having doubled in 2016 compared to 2018. According to the World Health Organization (WHO), 2.298 million infants die globally each year, with one million dying on their first day and nearly another million within the first four days of life (23,24).
A study by Ramalho et al. (2008) reported 27,065 deaths in adults in the West Bank region between 1999 and 2003. Circulatory diseases, cancer, unintentional injuries, infectious diseases, maternal and prenatal conditions, and nutritional deficiencies were the leading causes of death, respectively. Among males, the highest standardized age mortality rates were related to the circulatory system, cancer, and unintentional injuries, respectively. Among females, the most common causes were circulatory diseases, cancer, and diabetes mellitus (25). In the study of Kohi et al. (2015) in Iran, during the years 2006-2011, 1,172,278 deaths were reported in the country, of which 46.04% (539679 cases) were due to cardiovascular diseases. Although the death rate due to cardiovascular diseases decreased from 2006 to 2008, it increased in 2009 and 2010 (26). In a study by Chaman et al. (2010) conducted in Shahrood over four years (2004-2007), cardiovascular diseases, accidents, cancer, and tumors were identified as the leading causes of death, with heart disease responsible for the most years of life lost (27). In the study of Mirzaei and Alikhani (2007) in estimating the level and determining the factors affecting mortality in Tehran in 2005 and the trend of its epidemiological developments in the last thirty years, cardiovascular diseases in 1975 and 2005 were among the leading causes of death (28).
According to the findings, the disease rate of the respiratory system was increasing during the study years. Considering that the most important risk factors for diseases of the respiratory system include smoking, exposure to internal and external pollutants, allergens, occupational exposure, unhealthy diet, obesity, physical inactivity, and other factors (29) and due to the rapid population growth and exposure to these risk factors, more comprehensive research throughout Iran seems necessary.
In general, and based on the findings, a significant number of deaths do not fall under the medical definition of disease. Cancers, cardiovascular disease, and many other chronic diseases can only be treated with prevention (30). Accidents, suicides, and murders caused by violence can also be prevented only through social policies. Therefore, the health system must move in a direction that reduces the emphasis on treatment and medicine and increases prevention and social programs (31).
In total, in Golestan Province from 2011 to 2018, there was a total of 862,542 years of life lost due to premature death, which was 499,300 years for males and 363242 years for females. A study in Qazvin Province has shown that during the years 2004-2008, a total of 353,181 years has been wasted due to all causes of death (29). In a study in Ilam Province in 2016, about 32,000 years of life due to premature death was lost (11). The loss of life at a young age is particularly significant for society in terms of workforce impact, as it represents a substantial loss of human capital for the province.
One of the limitations of this study is the reliance on data from the current registration system, affected by issues such as inaccuracies in reporting causes of death, underreporting, misregistration, insufficient information exchange among organizations (Like the Civil Registration Organization and Forensic Medicine Organization), and incomplete demographic information, including details about occupation and marital status. Comparison of the collected data with registration records indicated that not all deaths were documented prior to 2014. However, from 2014 onward, both quantity and quality of death data in the province gradually improved and approached the number announced by the registration. Also, due to failure to record many deaths in 2012, civil registration data has been used. In this context, some changes in death data can be justified. Also, information from all years is considered without accounting for stillbirths.
Conclusion
Considering that the three main causes of death in Golestan Province are chronic and non-communicable diseases and accidents, it is suggested that more attention be paid to the design and implementation of preventive measures at the primordial and primary levels regarding these diseases. It is also suggested develop models and forecasts of mortality trends to discern patterns in mortality, which can then be shared with researchers, planners, and policymakers. It should also pay attention to the study of the trend and causes of mortality from 2019 onwards in Golestan Province and after the onset of the coronavirus epidemic.
Ultimately, it can be concluded that the number of male deaths in Golestan Province was about 1.3 times more than female deaths. The highest percentage of deaths was in the age group of 65 and above, and this may explain the high average age of the dead in this province. The three main causes of death in Golestan Province from 2011 to 2018, include diseases of the cardiovascular system, cancers, and external causes of death (Accidents), respectively. The highest rate of specific mortality is due to diseases of the cardiovascular system, while the lowest is related to mental and behavioral disorders and diseases of the hematopoietic and immune systems.
Acknowledgement
None.
Funding sources
This study was supported by the Golestan University of Medical Sciences (Grant number: 111277).
Ethical statement
The study was approved by the Ethics Committee of Golestan University of Medical Sciences (Ethics approval code: IR.GOUMS.REC.1398.329).
Conflicts of interest
The authors declare that they have no competing interests.
Author contributions
AH: Conceptualization, project administration. MJK: Conceptualization, investigation, visualization. MG: data collection. ZK: Software, validation, methodology, drafting of the manuscript. NR: drafting of the manuscript. All authors read and approved the final manuscript.
Full-Text: (1148 Views)
Introduction
To maintain and enhance human health, it is essential to gather information, monitor the current conditions, and establish appropriate priorities for the future (1). It is important to determine as accurately as possible the underlying causes of death as well as the age groups in which most deaths occur (2). The study of mortality trend and its causes from the viewpoint of demographic, sociological, and health can be complex because mortality is not just a biological issue, it is influenced by various factors, including the level of development of societies, environmental and geographical factors, as well as cultural, social, economic, health, and medical aspects play a prominent role in the rates and causes of death (3,4).
Demographic indicators have consistently been crucial in macro-demographic decision-making. Among these, the mortality rate is a key factor influencing changes in a country's population structure. Therefore, information about the number of deaths and their causes is one of the most basic pieces of information needed to diagnose the health status of the community and deal with risk factors (5). The mortality rate in the community is one of the most important indicators of health. Data on deaths categorized by age and gender are essential for assessing health status. Together with other epidemiological, economic, and social information, they form the foundation for health-related decision-making (6).
The increasing burden of non-communicable diseases, especially in developing countries, has become a threat to health services. Non-communicable diseases include cardiovascular diseases, stroke, diabetes, cancer, and respiratory problems (7,8). On the other hand, the focus on infectious diseases remains critically important in health systems due to their emergence and recurrence (9,10). Recent studies on the causes of death in Iran indicate a decline in deaths from infectious diseases. In contrast, deaths due to non-communicable diseases, especially cardiovascular disease, unintentional accidents, and cancers have increased. Additionally, the death rate due to infectious diseases and maternal mortality is decreasing, while the gender gap in mortality due to behavioral factors is increasing. Although cardiovascular disease is the leading cause of mortality differences between men and women in industrialized countries, the scenario may vary in developing countries like Iran (9).
The findings of the study conducted by Moradabadi and Torkashvand showed that about 2,500 deaths occurred annually in Ilam Province from 2011 to 2017. The main causes of death included non-communicable diseases such as cardiovascular diseases, cancers, and accidents that were unintentional. Accidents ranked as the second leading cause of death for males, while cancers were the second leading cause for females. In older age groups, non-communicable diseases, particularly cardiovascular diseases, were predominant, whereas, among younger individuals, social issues such as unintentional accidents, violence, and suicide were the primary contributors to the loss of human capital (11). Analyzing the trends in the causes of death within a society provides insights into the overall health transformations occurring in that community (12). Considering that the rates and trends of mortality changes in Golestan Province have not been studied in general, this study was conducted to evaluate the mortality trend and years of life lost due to causes of death in Golestan Province from 2011 to 2018.
Methods
The statistical population for this study included all deaths recorded by the Health Department of Golestan University of Medical Sciences from 2011 to 2018. The research employed a documentary method, collecting information through a counting approach. Mortality information was obtained from the statistics and performance analysis unit of Golestan University of Medical Sciences. In addition to the cause of death, this file also provided information on the sociological characteristics of the deceased (Age and sex). The disease classification system is based on ICD10. Causes of death are determined and coded by the international classification of diseases. Then, to qualitatively evaluate the death cause data, the data were examined and modified in terms of the impossible cause of death codes in terms of gender and age, the probable cause of death codes in terms of lethal causes, and the cause of death codes in poorly defined or absurd cases. To correct the codes of impossible causes of death in terms of age and sex and the codes of possible causes of death in terms of fatality, the framework for studying the global disease burden for 2010 and 2013 was used (13-15) and to correct the codes of causes of death due to poorly defined conditions. Furthermore, it was erroneously assumed that each code, regardless of age and sex, accurately reflects the cause of death, following the distribution of causes of death within those age and sex groups (16).
According to the general population and housing census, the population of Golestan Province was 1,777,014 in 2011 and increased to 1,868,819 in 2016. It should be noted that to derive the rates from the census data of 2011 and 2016 as well as demographic estimates between the two censuses, population growth rates and demographic information categorized by gender and age group were utilized. For population estimates in this paper, the mathematical method was used according to the following equation, where Pt + n is population in the second census, Pt is population in the first census, n is distance between the two censuses and r is the annual population growth rate that is the basis of calculations (Equation 1).
For standardized measures, the direct standardization method, i.e. direct age matching, was used. Standard populations were also used to compare census results for the period under comparison. Also, to compare the death rate by year and the cause of the disease, the total population during the study years was used as the standard population.
In this study, the methodology from the 2003 Global Burden of Disease study was utilized to ensure comparability. Moreover, to calculate the years of life lost (YLL), the standard expected years of life lost (SEYLL) was used. This method uses the standard life expectancy at any age to estimate the years lost due to death at that age. This life expectancy is called standard because it is calculated based on a specific life table that gives the ideal life expectancy. The biological differences between males and females in terms of survival were 2.5 years, and the Coale and Demeny model life tables (Model West, level 26) for females and males were used to determine life expectancy in different age groups (17). The following calculations were performed using Excel templates provided by the primary designers of the disease burden project, along with the 2000 burden of disease project weights, which have been validated for compatibility with the perspectives of Iranian experts in the referenced articles (17,18).
Where:
The demographic information of the deceased, which led to their identification, was initially deleted and then provided to the research team. The authors pledged that their personal and confidential information (Individually) would not be used. After modifying and cleaning the data, WinPepi 11.65 was used to calculate the rates, and Microsoft Excel 2016 was used for frequency distributions and line graphs.
Results
During 2011-2018, 60,082 deaths were reported, of which 56.8% were males and 43.2% were females. The mean age of the deceased was 58.92 ± 26.64 which was 57.25 ± 26.62 for males and 61.30 ± 26.32 for females. In all years related to this study, deaths were higher in males than females. The death rate was 4.9 per 1,000 population in males and 3.8 per 1,000 population in females. The average crude death rate was 4.34 per 1,000 population. The death rate was relatively constant from years 2011 to 2012 and after a slight decrease in 2013 (3.6 per 1,000 population) then had an upward trend and in 2017 reached 4.66 per 1,000 population (Figure 1). Age-specific death rate for 2011 and 2016 remained relatively constant, increasing from 4.35 per 1,000 population in 2011 to 4.41 in 2016 (Figure 2). In all study years, the highest death rate was in the age group of 65 years and older, followed by 55-64 years and in the age group of under five years. In general, after the initial five years of life, there is a consistent rise in mortality with increasing age, indicating a relatively high mortality rate.
Causal-specific death rate trends show that cardiovascular diseases, accidents, cancers, and endocrine, nutritional, and metabolic diseases were the most important causes of death in 2011, respectively. In 2016, cardiovascular diseases, cancers, accidents, and congenital and chromosomal abnormalities were the most important causes of death, respectively. As shown in Figure 4, the trend of respiratory diseases increases slightly from 2011 to 2018. To compare the causal death rates for 2011 and 2016, the direct standardization method was employed, using the total provincial population of 3,633,794 for both years as the reference population. The death rate due to cardiovascular diseases and cancers in 2016 (2.19 and 0.59, respectively) was higher than in 2011 (1.65 and 0.43, respectively), while death rate due to external causes was lower in 2016 (0.44) than in 2011 (0.51) (Table 1). In Golestan Province from 2011 to 2018, there were a total of 862,542 years of life lost due to premature death, which was 499,300 years for males and 363,242 years for females. The total number of years of life lost in all years of 2011-2018 was more in males than females. The highest rate was 81.1 per 1,000 population in males and 66.4 per 1,000 population in 2017 (Table 2).

Discussion
In this study, the mortality trend in Golestan Province has been studied from 2011 to 2018. According to the findings, the average crude death rate during the study years was 4.34 per 1,000, with 4.91 and 3.79 per 1,000 population for males and females, respectively. In the study by Zangana et al. (2019) in Erbil, Iraq, between 2007 and 2011, the crude mortality rate was 3.1 per 1,000 population, indicating that the mortality rate was higher in females than in males (3.5 and 2.7, respectively) (2). In the study conducted by Torkashvand et al. (2019) in Ilam Province from 2011 to 2017, the death rate of males was higher than females (11). Sadek et al. (2012) assessed the mortality pattern in Basra, Iraq, using the registry system mortality data over two years (1978 and 2007). They showed the standardized age mortality rate in 2007 was 8.6% lower than in 1978. In both years, the standardized age mortality rate increased with age, so the highest rate was seen among the elderly 65 years and older (19).
The results showed that in 2011 and 2016, Age-specific death rate was relatively stable and increased from 4.35 per 1,000 population in 2011 to 4.41 in 2016. In another study, the mean Age-specific death rate for the years 2009 to 2011 was 4.6 per 1,000, which was similar to our study (2). The data showed that annually, the highest mortality rate was found among individuals aged 65 and older, followed by those between 55 and 64 years old, and then children under five. In the study of Abdollahzadeh et al. (2016) in the population covered by Birjand University of Medical Sciences, the highest number of deaths in 2018 was related to the age group of 70-90 years (20). In another study, the highest mortality rate was observed among individuals aged 75 years and older (2).
According to the findings, cardiovascular diseases, accidents, cancers, and endocrine, nutritional, and metabolic diseases were the most important causes of death in 2011, respectively. In 2016, cardiovascular diseases, cancers, accidents, and congenital and chromosomal abnormalities were the most important causes of death, respectively. In the study of Zangana et al. (2019), mortality due to accidents and cardiovascular diseases was the main cause of death with 65.2 and 58.3 per 100,000 population, respectively. The most common causes of death were accidents and injuries, which accounted for 29.1% of all deaths (65.24 per 100,000 people), followed by cardiovascular diseases with 25.5% (57.27 per 100,000 population), respiratory disorders with 18.9% (42.43 per 100,000 people) and cancers with 7.9% (15.60 per 100,000 people) (2).
In a study by Di Cecco et al. (2016) in Argentina, time series of deaths for individuals aged 1 to 24, categorized by sex and cause of death, were compiled for the period from 1947 to 2012. The highest reduction in mortality was observed in the age group of 1-4 years. Women and girls of all ages had a significant reduction in mortality. Mortality rates decreased in boys and men aged 15 to 24, but were much lower than in other groups. The mortality rate in this group was twice as high as women and girls by 2012. Mortality due to transmissible causes, nutrition, and childbirth decreased in all groups, while mortality due to sedation increased in young men (21).
In another study, the main causes of death were non-communicable diseases, cardiovascular diseases, cancers, and unintentional accidents, respectively (11). In the study by Sadek et al. (2012), among the nine causes of death, cardiovascular disease was the leading cause of death in both years. Cancer was the third leading cause of death in 1978 and the second leading cause of death in 2007. The standardized age mortality rate in 2007 was 6% higher than in 1978. In 2007, deaths from circulatory diseases in the elderly age group were 25.5% higher than the death rate for the same age group in 1978. External causes were the second leading cause of death in 1978 and the third leading cause of death in 2007. External causes were the main cause of death for the age group of 15-44 years each year (19).
Mortality due to accidents had a decreasing trend during the study years. The study of Askari Shahi et al. Also showed that the mortality rate due to road accidents during the study period had a decreasing trend (22). Deaths due to certain conditions originating around birth were also among the main causes of death, having doubled in 2016 compared to 2018. According to the World Health Organization (WHO), 2.298 million infants die globally each year, with one million dying on their first day and nearly another million within the first four days of life (23,24).
A study by Ramalho et al. (2008) reported 27,065 deaths in adults in the West Bank region between 1999 and 2003. Circulatory diseases, cancer, unintentional injuries, infectious diseases, maternal and prenatal conditions, and nutritional deficiencies were the leading causes of death, respectively. Among males, the highest standardized age mortality rates were related to the circulatory system, cancer, and unintentional injuries, respectively. Among females, the most common causes were circulatory diseases, cancer, and diabetes mellitus (25). In the study of Kohi et al. (2015) in Iran, during the years 2006-2011, 1,172,278 deaths were reported in the country, of which 46.04% (539679 cases) were due to cardiovascular diseases. Although the death rate due to cardiovascular diseases decreased from 2006 to 2008, it increased in 2009 and 2010 (26). In a study by Chaman et al. (2010) conducted in Shahrood over four years (2004-2007), cardiovascular diseases, accidents, cancer, and tumors were identified as the leading causes of death, with heart disease responsible for the most years of life lost (27). In the study of Mirzaei and Alikhani (2007) in estimating the level and determining the factors affecting mortality in Tehran in 2005 and the trend of its epidemiological developments in the last thirty years, cardiovascular diseases in 1975 and 2005 were among the leading causes of death (28).
According to the findings, the disease rate of the respiratory system was increasing during the study years. Considering that the most important risk factors for diseases of the respiratory system include smoking, exposure to internal and external pollutants, allergens, occupational exposure, unhealthy diet, obesity, physical inactivity, and other factors (29) and due to the rapid population growth and exposure to these risk factors, more comprehensive research throughout Iran seems necessary.
In general, and based on the findings, a significant number of deaths do not fall under the medical definition of disease. Cancers, cardiovascular disease, and many other chronic diseases can only be treated with prevention (30). Accidents, suicides, and murders caused by violence can also be prevented only through social policies. Therefore, the health system must move in a direction that reduces the emphasis on treatment and medicine and increases prevention and social programs (31).
In total, in Golestan Province from 2011 to 2018, there was a total of 862,542 years of life lost due to premature death, which was 499,300 years for males and 363242 years for females. A study in Qazvin Province has shown that during the years 2004-2008, a total of 353,181 years has been wasted due to all causes of death (29). In a study in Ilam Province in 2016, about 32,000 years of life due to premature death was lost (11). The loss of life at a young age is particularly significant for society in terms of workforce impact, as it represents a substantial loss of human capital for the province.
One of the limitations of this study is the reliance on data from the current registration system, affected by issues such as inaccuracies in reporting causes of death, underreporting, misregistration, insufficient information exchange among organizations (Like the Civil Registration Organization and Forensic Medicine Organization), and incomplete demographic information, including details about occupation and marital status. Comparison of the collected data with registration records indicated that not all deaths were documented prior to 2014. However, from 2014 onward, both quantity and quality of death data in the province gradually improved and approached the number announced by the registration. Also, due to failure to record many deaths in 2012, civil registration data has been used. In this context, some changes in death data can be justified. Also, information from all years is considered without accounting for stillbirths.
Conclusion
Considering that the three main causes of death in Golestan Province are chronic and non-communicable diseases and accidents, it is suggested that more attention be paid to the design and implementation of preventive measures at the primordial and primary levels regarding these diseases. It is also suggested develop models and forecasts of mortality trends to discern patterns in mortality, which can then be shared with researchers, planners, and policymakers. It should also pay attention to the study of the trend and causes of mortality from 2019 onwards in Golestan Province and after the onset of the coronavirus epidemic.
Ultimately, it can be concluded that the number of male deaths in Golestan Province was about 1.3 times more than female deaths. The highest percentage of deaths was in the age group of 65 and above, and this may explain the high average age of the dead in this province. The three main causes of death in Golestan Province from 2011 to 2018, include diseases of the cardiovascular system, cancers, and external causes of death (Accidents), respectively. The highest rate of specific mortality is due to diseases of the cardiovascular system, while the lowest is related to mental and behavioral disorders and diseases of the hematopoietic and immune systems.
Acknowledgement
None.
Funding sources
This study was supported by the Golestan University of Medical Sciences (Grant number: 111277).
Ethical statement
The study was approved by the Ethics Committee of Golestan University of Medical Sciences (Ethics approval code: IR.GOUMS.REC.1398.329).
Conflicts of interest
The authors declare that they have no competing interests.
Author contributions
AH: Conceptualization, project administration. MJK: Conceptualization, investigation, visualization. MG: data collection. ZK: Software, validation, methodology, drafting of the manuscript. NR: drafting of the manuscript. All authors read and approved the final manuscript.
Type of Study: Original Article |
Subject:
Clinical
Received: 2024/08/13 | Accepted: 2024/10/19 | Published: 2024/11/27
Received: 2024/08/13 | Accepted: 2024/10/19 | Published: 2024/11/27
References
1. Borji A, Bayat M, Shamsabadi F, Amini F, Dayyani M, Mehrad Majd H. Epidemiology of gastrointestinal cancers (stomach, esophageal and colorectal) in Neyshabur city during 2006-2012. J Neyshabur Univ Med Sci. 2016;3(9):37-44. [View at Publisher] [Google Scholar]
2. Zangana A, Al-Banna H, Al-Hadithi T. Mortality trends in Erbil, Iraq, 2007-2011. East Mediterr Health J. 2019;25(5):315-21. [View at Publisher] [DOI] [PMID] [Google Scholar]
3. Van Hoek A, Campbell H, Amirthalingam G, Andrews N, Miller E. The number of deaths among infants under one year of age in England with pertussis: results of a capture/recapture analysis for the period 2001 to 2011. Euro Surveill. 2013;18(9):20414. [View at Publisher] [DOI] [PMID] [Google Scholar]
4. Heidari A, Kabir MJ, Khatirnamani Z, Jafari N, Gholami M, Honarvar MR, et al. Years of Life Lost due to accidents and injuries in Iran: A trend of five years (2014-2018). Journal of Emergency Medicine, Trauma and Acute Care. 2022;2022(2):2. [View at Publisher] [DOI] [Google Scholar]
5. Shoaee S, Gholi keshmarzi MM. Analysis of the Stochastic Mortality Models Based on Lee-Carter Model in Predicting Mortality Rates in Life and Health Insurance. Iran J Health Insur. 2021;4(1):68-79. [View at Publisher] [Google Scholar]
6. Sadooghi Z, Javaheri M, Sohrabian B, Poursafar A, Rezaei N. Examining The Cause And Five Year Trend Of Mortality Rate From 2007 To 2011 In Ilam Province, Iran. HSR. 2016;12(3):378-80. [View at Publisher] [Google Scholar]
7. Association AD. Introduction. Diabetes Care. 2017;40(Suppl 1):S1-2. [View at Publisher] [DOI] [PMID]
8. Khatirnamani Z, Bakhshi E, Naghipour A, Hosseinzadeh S. Assessment of hemoglobin A1C in patients with Type 2 diabetes in the first three years of care and its related factors. JHPM. 2017;6(5):34-42. [View at Publisher] [DOI] [Google Scholar]
9. Askari-Nodoushan A, Sasanipour M, Koosheshi M, Khosravi A. Patterns of Sex Differences in Mortality in Iran, 2006-2015. Women in Development & Politics. 2018;16(3):415-38. [View at Publisher] [DOI] [Google Scholar]
10. Abbaszadeh A, Akbari Kaji M, Mohamadnejad E, Tabatbaei A, Ehsani SR. Nurses' Perceptions of Caring of Emerging Avian Influenza Disease. Nursing and Midwifery Journal. 2015;12(11):973-81. [View at Publisher] [Google Scholar]
12. Torkashvand Moradabadi M, Torkashvand Z. Epidemiological transition and the importance of social policy: mortality statistic in Ilam, Iran during 2011-2017. Payesh (Health Monitor). 2019;18(4):321-31. [View at Publisher] [DOI] [Google Scholar]
13. Faghihi F, Jafari N, Akbari Sari A, Nedjat S, Hosainzadeh M. Trend of Mortality Rate and Causes of Death in Qazvin Province, 2004- 2008. Iran J Forensic Med. 2015;21(1):35-42. [View at Publisher] [Google Scholar]
14. Naghavi M, Makela S, Foreman K, O'Brien J, Pourmalek F, Lozano R. Algorithms for enhancing public health utility of national causes-of-death data. Popul Health Metr. 2010;8:9. [View at Publisher] [DOI] [PMID] [Google Scholar]
15. Lozano R, Naghavi M, Foreman K, Lim S, Shibuya K, Aboyans V, Abraham J, Adair T, Aggarwal R, Ahn SY, AlMazroa MA. Global and regional mortality from 235 causes of death for 20 age groups in 1990 and 2010: a systematic analysis for the Global Burden of Disease Study 2010. The lancet. 2012;380(9859):2095-128. [View at Publisher] [DOI] [PMID] [Google Scholar]
16. World Health Organization. Analysing mortality levels and causes-of-death (ANACoD3). Electronic Tool, Version 1.1. Department of Health Statistics and Information Systems, WHO, Geneva, Switzerland; 2013. [View at Publisher]
17. Naghavi M, Jafari N. Report of death in Iran. Tehran: Ministry of Health and Medical Education. 2007:1-9. [View at Publisher] [Google Scholar]
18. Mathers CD, Bernard C, Iburg KM, Inoue M, Ma Fat D, Shibuya K, et al. Global burden of disease in 2002: data sources, methods and results. Geneva: World Health Organization. 2003. [View at Publisher] [Google Scholar]
20. Ayatollahi SMT, Hassanzadeh J, Ramezani AA. The Burden of Traffic Accidents in South Khorasan Province, Iran in 2005. Iran J Epidemiol. 2009;4(3 and 4):51-7. [View at Publisher] [Google Scholar]
21. Sadek HN, Ajeel NAH. Age-standardized mortality rates by cause in Basra, Iraq: 1978 and 2007. East Mediterr Health J. 2012;18(10):1049-54. [View at Publisher] [DOI] [PMID] [Google Scholar]
22. Abdollahzadeh R, Mehrapour R, Shafiei T, Farabi R, Kafaei S. Causes and rate of death in population covered by Birjand University of Medical Sciences. J Prevent Med. 2020;7(3):71-62. [View at Publisher] [DOI] [Google Scholar]
23. Di Cecco V, Alazraqui M, Spinelli H. Mortality trends in young people aged 1-24 years: Argentina, 1947-2012. Ann Glob Health. 2016;82(5):738-48. [View at Publisher] [DOI] [PMID] [Google Scholar]
24. Askarishahi M, Rezazadeh Z, Vakili M. Trend in the Deaths of Road Accidents in Iran in Years 2006-2017. J Babol Univ Med Sci. 2020;22(1):318-25. [View at Publisher] [DOI] [Google Scholar]
25. WHO. Newborn mortality. 2024. [View at Publisher]
26. Haghshenas Mojaveri M, korfi Sh, khafri S, Akbarian Rad Z. The Causes of Neonatal Death in the NICU. J Babol Univ Med Sci. 2020;22:59-64. [View at Publisher] [DOI] [Google Scholar]
27. Ramalho AA, Andrade AMd, Martins FA, Koifman RJ. Infant mortality trend in the city of Rio Branco, AC, 1999 to 2015. Rev Saude Publica. 2018;52:33. [View at Publisher] [DOI] [PMID] [Google Scholar]
28. Kohi F, Salehinia H, Mohammadian-Hafshejani A. Trends in mortality from cardiovascular disease in Iran from 2006-2010. J Sabzevar Univ Med Sci. 2015;22(4):630-8. [View at Publisher] [Google Scholar]
29. chaman R, Gholami Taromsari M, Yaghoti A. Investigating the Trend of the Causes of Mortality in Shahroud Population over a Four-Year Period (2004-2007). Journal of Knowledge and Health (Special Issue of the 6th Iranian Epidemiology Congress). 2010;5. [View at Publisher]
30. Mirzaee M, Alikhani L. Estimation and Survey of Factors Affecting Mortality in Tehran in 2005 and its Epidemiological Trends in the Last Thirty Years. Iranian Demographic Association. 2007;3(2):30-60. [View at Publisher]
31. Faghihi F, Jafari N, Akbari Sari A, Nedjat S, Maleki F, Hosainzadehmilany M. The Leading Causes of YLL (Years of Life Lost) in the Province of Ghazvin and Comparison with Other Countries, Iran. Iran J Epidemiol. 2015;11(1):20-30. [View at Publisher] [Google Scholar]
32. Yosefnia Pasha S, Mohamadi M, Abesi F, Khafri S. Frequency of Maxillofacial Fractures among Patients with Head and Neck Trauma Referred to Shahid Beheshti Hospital in Babol, 2018-2019. J Babol Univ Med Sci. 2021;23:126-34. [View at Publisher] [Google Scholar]
33. Ataey A, Moradi Asl E, Mirzaei E, Darsaraei F. Epidemiology of Death and Years of Life Lost (YLL) Due to Accidents in Ardabil Province. Journal of Health. 2019;10(1):50-7. [View at Publisher] [DOI] [Google Scholar]
34. Taheri M, Nazari J, Anoshirvani AA, Aghabozorgi R, Tabaeian SP, Bahrami M, et al. Incidence trend of gastrointestinal cancer in Markazi, in the Center of Iran, population-based cancer registry results: 2010-2014. J Gastrointest Cancer. 2021;52(3):915-21. [View at Publisher] [DOI] [PMID] [Google Scholar]
35. Moosavi SS, Farshid R, Jafari Baghi Abadi S. The Role of Medical and Health Archives in Scientific Research from a Scientometrics Perspective. Iran J Med Microbiol. 2021;15(5):508-36. [View at Publisher] [DOI] [Google Scholar]
Send email to the article author
| Rights and permissions | |
 |
This work is licensed under a Creative Commons Attribution-NonCommercial 4.0 International License. |
